Coffee roasting: why taste sensors and aroma tests differ
Temperature and time change several parts of a coffee profile. A Yellow Bourbon experiment separates taste-sensor responses, volatile patterns and odor observations, explaining why the three tests answer different questions.
Published Jul 1, 2025
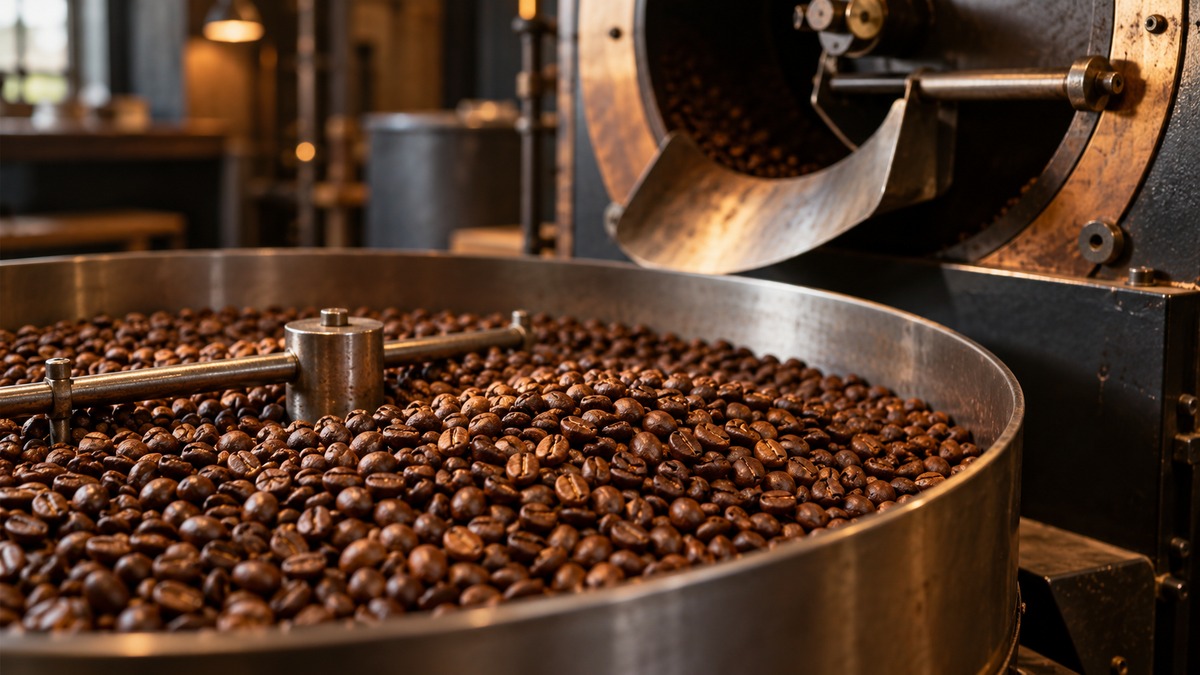
A roasting business and a measurement problem
Liu Jiadi combines a cafe with a roasting studio in Shenyang, in northeast China. His customers include individuals and specialty coffee shops, with roasting plans tailored to different beans. He developed his skills through online learning and professional training in Beijing after co-founding the shop with a friend. These activities formed the business profile published by Xinhua on 1 July 2025. Tailoring a roast involves several characteristics that can be investigated separately: the response of a liquid extract, its volatile profile and the odors associated with separated compounds.
A taste sensor contacts a prepared liquid. An analysis of the headspace samples compounds entering the gas above that liquid. An olfactory detection port adds odor observations to chromatographic separation. Each procedure therefore has a particular sample preparation and a particular output. The same roasted beans can supply material for all three procedures, while the resulting datasets still describe different aspects of the preparation. Temperature and roasting time can be compared within each dataset, and the grouping of samples can then be examined across methods. Agreement between groupings concerns those measurements and conditions.
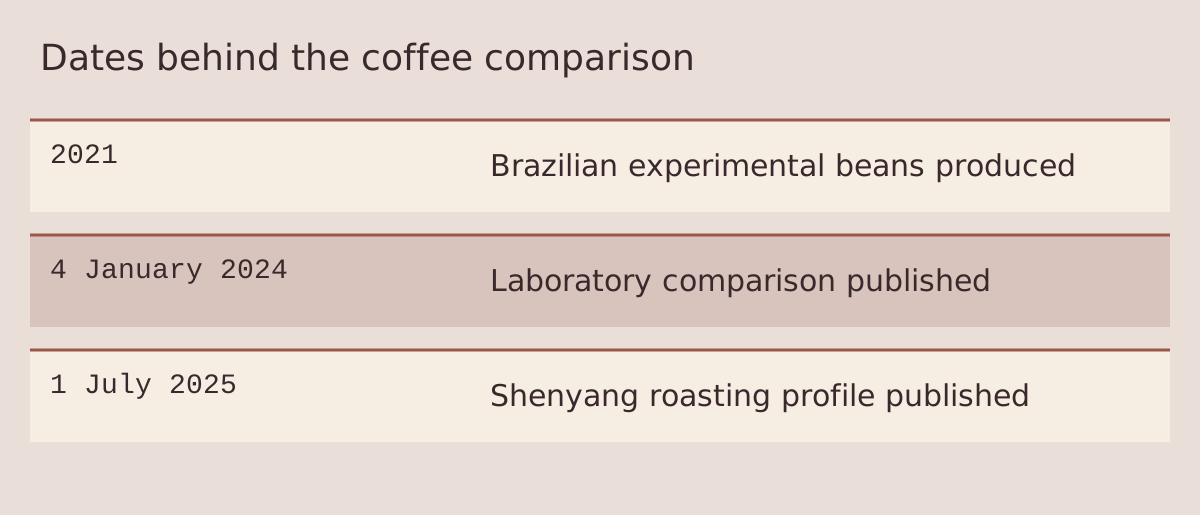
Illustration details
- Dates behind the coffee comparison
- 2021
- Brazilian experimental beans produced
- 4 January 2024
- Laboratory comparison published
- 1 July 2025
- Shenyang roasting profile published
A laboratory comparison published on 4 January 2024 examined Yellow Bourbon, a cultivar of Coffea arabica. Seong Jun Hong and colleagues used beans produced in Cerrado, Minas Gerais, Brazil, in 2021, purchased as NY2 FC grade material. The work combined electronic-tongue measurements, electronic-nose analysis and gas chromatography–mass spectrometry with olfactometry. Its material, equipment and measurements were separate from Liu’s business. The experiment provides a defined comparison of roasting conditions; it does not establish which equipment or recipe the Shenyang studio uses.
Temperature, time and the prepared coffee
The roasting programme used two temperatures, 150 °C and 210 °C, and three durations at each temperature: 10, 20 and 30 minutes. An unroasted reference accompanied the six roasted conditions, giving seven conditions for comparison. Each roasting preparation used 15 g of beans in a laboratory coffee roaster. Temperature and duration remained separate labels throughout the analysis. A sample roasted for 20 minutes at 150 °C therefore belonged to a different condition from one roasted for the same duration at 210 °C. These are the experiment’s stated settings, rather than measured temperatures at every point inside every bean.
Grinding and brewing followed a common preparation. Both unroasted and roasted material were ground to a stated medium particle size of 600 micrometres. The brewing preparation combined 15 g of ground material with 200 mL of water at 95 °C for five minutes. Keeping these steps specified allows the subsequent measurements to be read as results for prepared extracts. The roasting condition is one part of that description; the grinding and water-extraction procedure are further parts. A change in a measured liquid profile therefore belongs to a complete preparation, including the extraction used before the instrument receives its sample.
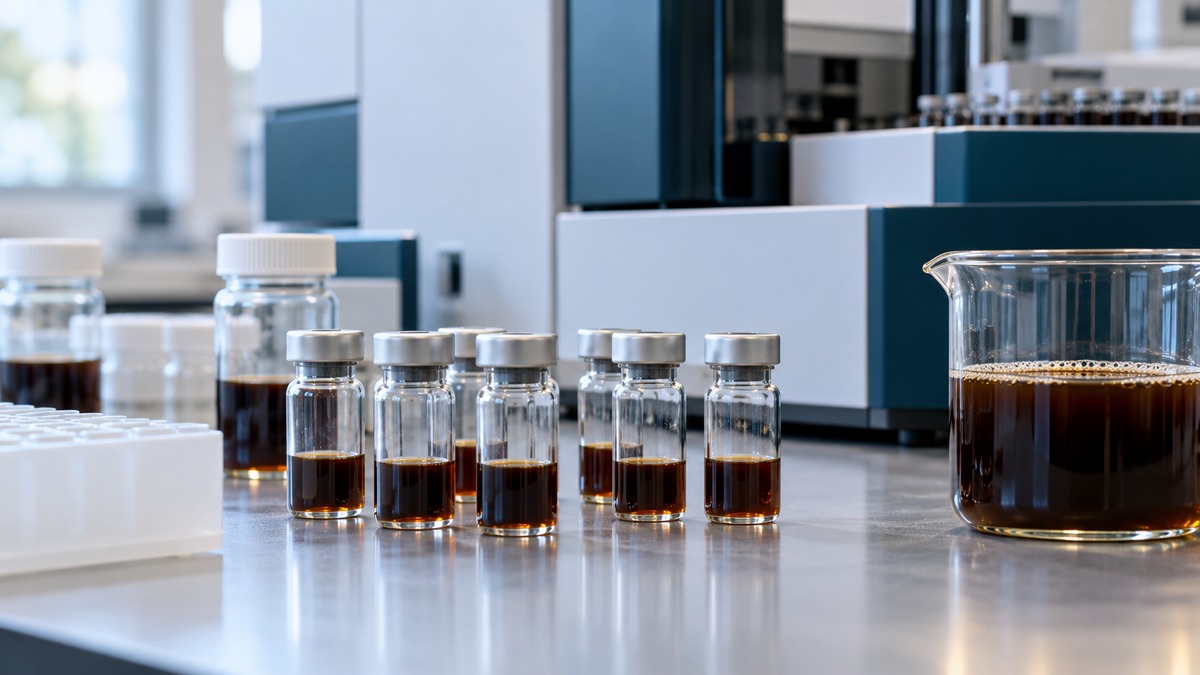
The three analytical routes began with portions of coffee extract but treated those portions differently. The electronic tongue used a diluted liquid in contact with sensors. The electronic nose examined the headspace after warming a small portion in a vial. The olfactometry route used a coated fibre to collect headspace compounds before chromatographic analysis. These routes generated taste-sensor values, a volatile profile and odor-associated observations, respectively. Their outputs could be organized by the same roasting labels without becoming the same kind of measurement. The preparation details remain necessary when comparing results between the routes.
What the electronic tongue measured
For the electronic-tongue procedure, 10 mL of coffee extract was combined with 90 mL of purified water. The sensor contact lasted two minutes. Five sensors carried the taste labels sourness, saltiness, umami, sweetness and bitterness, abbreviated SRS, STS, UMS, SWS and BRS. The sensors were washed with purified water between samples to reduce cross-contamination. The recorded values were responses from this instrument and preparation. Their labels provide a way to organize the data, while a consumer’s experience of drinking a full-strength cup remains a separate form of sensory evidence.
The five responses formed a profile rather than a single taste score. A change in the bitterness-labelled channel could be examined alongside the sweetness-labelled or sourness-labelled response. The researchers displayed these profiles together and used them as input for multivariate analysis. This retained the possibility that channels would change differently across the roasting conditions. It also kept the identity of each channel visible in the interpretation: an increase in one sensor’s response did not mean that every measured part of the extract increased by the same amount or followed the same time pattern.
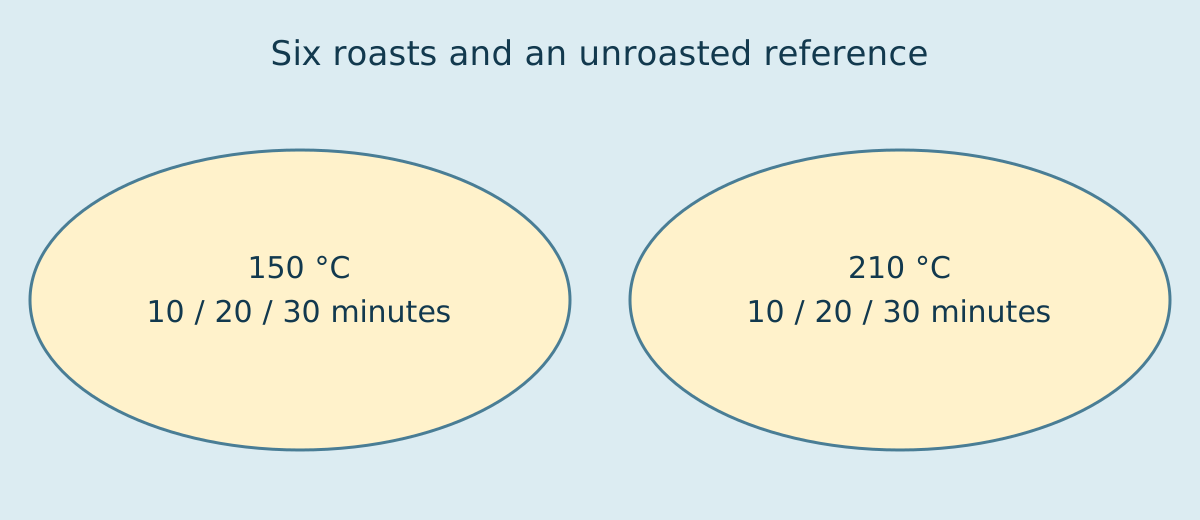
Illustration details
- Six roasts and an unroasted reference
- 150 °C
- 10 / 20 / 30 minutes
- 210 °C
- 10 / 20 / 30 minutes
At 150 °C, the sourness-labelled response generally declined after roasting, and the umami-labelled response declined with increasing roasting time. The 30-minute preparation had the lowest umami-labelled value within that series. The saltiness-, sweetness- and bitterness-labelled channels changed less markedly in the researchers’ description. Together, these observations describe a relatively restrained change in several channels alongside clearer changes in others. They refer to the diluted extracts and the instrument’s responses. The experiment did not convert the five channels into a verified preference ranking for customers buying roasted beans.
The 210 °C series showed a different response pattern. The sweetness- and bitterness-labelled values rose after roasting, while the saltiness- and sourness-labelled values declined. The bitterness-labelled response increased with roasting time. These changes separated the higher-temperature preparations from much of the lower-temperature series in the taste dataset. The channel names alone do not identify the concentration of a particular sugar, acid or bitter compound: the observations are sensor responses to the prepared mixture. The study’s comparison therefore concerns the whole measured profile, with the roasting temperature and duration retained beside each preparation.
Reading the taste-pattern analysis
Principal component analysis provided a way to display variation in the taste-sensor dataset. The first component accounted for 79.94% of its variation and the second for 18.39%, giving 98.33% together. These percentages describe variation represented by the two components in that dataset. They are not a percentage of consumers agreeing with a description or a success rate for predicting an unfamiliar coffee. The position of each preparation in the analysis depended on its combination of sensor values, allowing the researchers to examine several channels together rather than selecting only one taste-labelled response.
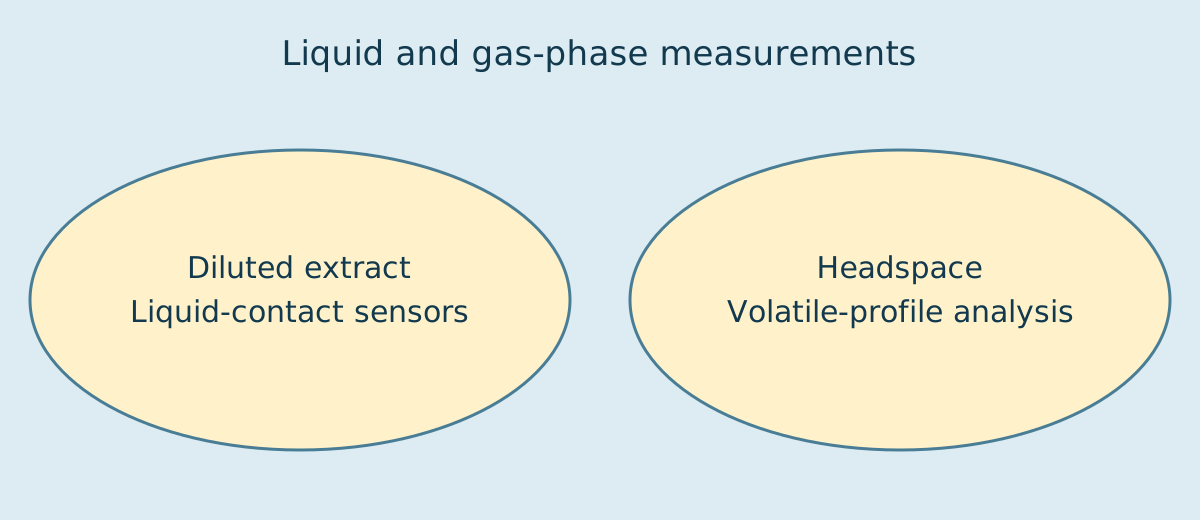
Illustration details
- Liquid and gas-phase measurements
- Diluted extract
- Liquid-contact sensors
- Headspace
- Volatile-profile analysis
Cluster analysis of the taste data placed the preparations roasted at 210 °C together, while the unroasted reference and the 150 °C preparations formed another cluster. That grouping emphasized the temperature difference in this particular dataset. The principal-component display also retained some separation associated with time within the series. Thus, temperature-based grouping and differences among individual preparations appeared at different levels of the analysis. A cluster describes similarity under the selected measurements; it does not assign a commercial grade, a roast designation or a price to the beans represented by its members.
Sampling the volatile profile
The electronic-nose route began with 2 mL of coffee extract in a sealed headspace vial. The vial was held at 50 °C for 20 minutes during preparation, and a headspace portion was then introduced into the instrument. Here, 50 °C belonged to the analytical sampling stage, following brewing; it was distinct from the 150 °C and 210 °C roasting settings. The measured material was the gas-phase sample above the extract. Consequently, the volatile profile described compounds captured under that headspace procedure, rather than a direct measurement of everything present in the original green or roasted beans.
In this experiment, the electronic nose incorporated chromatographic separation and a flame-ionization detector. Retention-index information and a library supported the assignment of signals to candidate compounds and chemical groups. This output differed from the five liquid-contact taste channels. A chromatographic profile retained information about signals appearing during separation, while the library supplied proposed chemical assignments. These two records supported the subsequent grouping of the preparations. The comparison of roasting conditions used the measured profiles together with those annotations, preserving the distinction between instrumental detection and chemical identification.
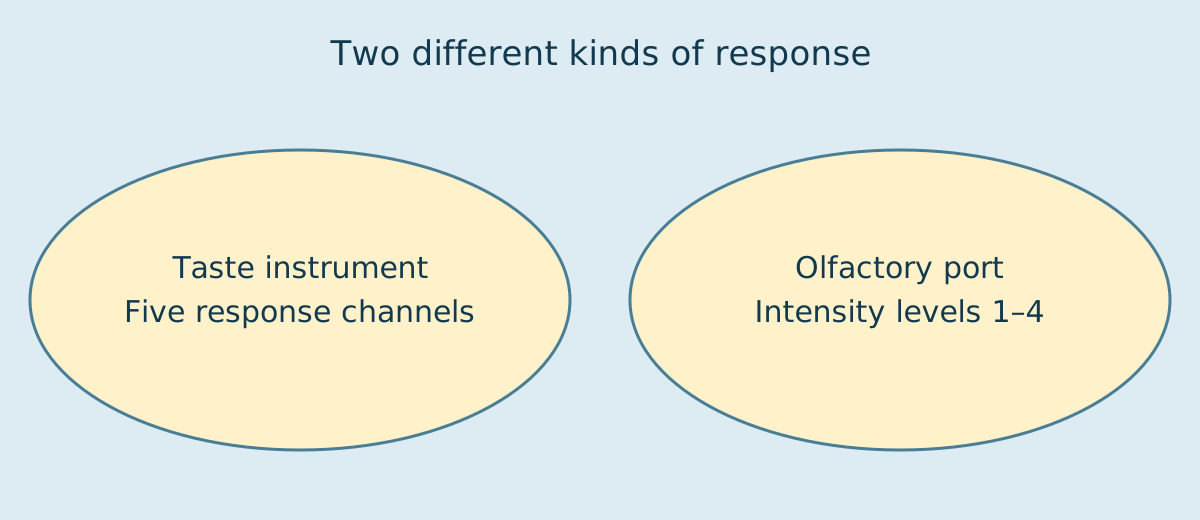
Illustration details
- Two different kinds of response
- Taste instrument
- Five response channels
- Olfactory port
- Intensity levels 1–4
The volatile dataset changed particularly strongly for the preparations roasted at 210 °C for 20 and 30 minutes. The researchers associated these later conditions with larger responses in several annotated groups, including aldehydes, ketones and sulfur-containing compounds. Some reported patterns differed between the 150 °C and 210 °C series, so duration alone did not describe the changes. These are patterns within the study’s headspace analysis and library-based grouping. They provide a separate view from the liquid-contact sensor data, even though both routes began with coffee extracts prepared from the same set of roasting conditions.
The first two principal components of the electronic-nose dataset represented 61.20% and 17.54% of its variation, or 78.74% together. Cluster analysis separated the 210 °C preparations roasted for 20 and 30 minutes, the unroasted reference, and the remaining preparations into three groups. This grouping differed from the two-cluster description obtained for the taste data. In particular, the higher-temperature preparation roasted for only 10 minutes did not join the later 210 °C preparations in that volatile grouping. The different arrangement retained information about time as well as temperature.
Adding odor observations to chromatography
The gas chromatography–mass spectrometry–olfactometry route, abbreviated GC–MS-O, used 5 mL of extract. The sample headspace was equilibrated at 50 °C for 20 minutes, followed by collection on a solid-phase microextraction fibre for 30 minutes. The collected material was then introduced into the chromatographic system. A fibre-based collection and a direct headspace portion are different preparations, even when both use warmed coffee extract. This matters when reading the two volatile datasets together: their sample volumes, collection procedures and detection arrangements were specified separately rather than treated as interchangeable versions of one measurement.

Chromatographic separation was combined with mass-spectral information and an olfactory detection port. The mass-spectral component helped assign candidate chemical identities; the odor observations addressed the sensory character associated with separated material. Keeping these functions distinct is useful because an analytical signal and an odor observation are different records. The study combined them in an odor-associated dataset, alongside information about the roasting condition. It did not report that every compound detected anywhere in the analysis made an equally important contribution to a brewed cup’s overall aroma.
Odor intensity was recorded on four levels, from 1 to 4, with the larger number representing a stronger observation on that scale. This was an intensity scale for the olfactometry procedure, rather than a liking score. The odor descriptions included roasted and coffee-like notes. Those observations concerned material separated during the analytical run; they did not constitute a consumer comparison of complete drinks. The authors themselves identified a need for further work connecting human sensory tests with the instrument-based measurements. That boundary is especially relevant when interpreting results intended to inform tailored roasting.
The later 210 °C conditions were associated with a broader odor-related profile and with peaks assigned to the pyrazine group. The researchers linked that group with roasted and coffee-like descriptions. These odor observations accompanied chromatographic signals and library-supported chemical assignments, rather than a measurement of the overall aroma strength of a complete drink. The analytical profiles at 210 °C for 20 and 30 minutes differed from the earlier or lower-temperature preparations. Their association with the pyrazine group supplied one part of the researchers’ interpretation of that difference, alongside the other detected signals.
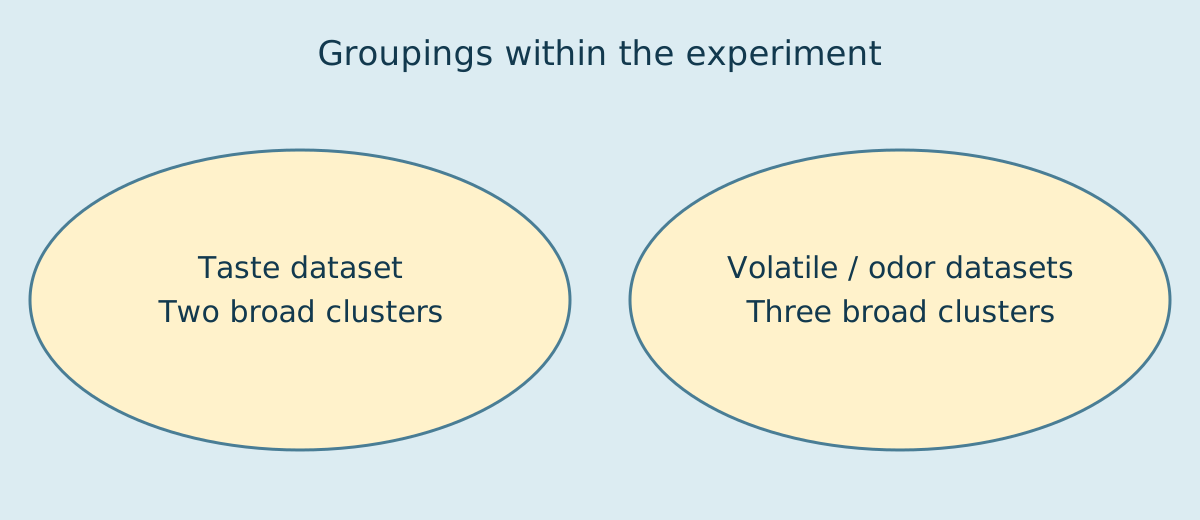
Illustration details
- Groupings within the experiment
- Taste dataset
- Two broad clusters
- Volatile / odor datasets
- Three broad clusters
A third view of the same conditions
For the odor-associated dataset, the first principal component represented 53.65% of variation and the second represented 18.03%, giving 71.68% together. Cluster analysis again grouped the 210 °C preparations roasted for 20 and 30 minutes apart from the unroasted reference and the other roasted conditions. This broad arrangement resembled the electronic-nose grouping more closely than the taste-sensor grouping. The comparison concerns the structure of the datasets: the preparations that appeared similar under one route could be compared with those appearing similar under another route, while preserving the different measurements behind them.
The number of repeated analyses also differed by route. The researchers reported six repeats for the electronic tongue, three for the electronic nose and two for GC–MS-O. Those counts belong beside the corresponding results. Repeating an analysis provides a different kind of evidence from sampling additional harvests, growing regions or cultivars. The experiment used the specified Yellow Bourbon material and its roasting conditions; the repeat counts do not expand it into a survey of all Brazilian coffees. They help describe how the reported datasets were obtained and why their sampling structures should remain visible during comparison.
Connecting the measurements without merging them
The electronic nose and GC–MS-O both distinguished the later 210 °C preparations strongly, while the taste sensors emphasized the broader separation between the temperature series. This agreement and difference can be expressed without selecting a winning instrument. The liquid sensors described responses to a diluted extract, the headspace route described a volatile profile, and the olfactometry route added odor observations to separated material. Each retained its own preparation, detector output and pattern analysis. Their joint use allowed the roasting conditions to be examined from more than one analytical perspective.
Roasting also changes the chemical setting in which these measurements arise. The Maillard reaction involves reducing sugars and amino-containing components, while caramelization and other thermal transformations contribute further changes. The study discussed these processes as context for evolving volatile profiles. Such reactions connect the original bean composition with the compounds available for extraction and detection after heating. They do not require every taste channel or annotated volatile group to follow one common trajectory. In this experiment, the two temperature series and the successive durations produced different combinations of responses across the analytical routes.
The results remain tied to the specified material, roasting equipment and preparation procedures. The experiment did not evaluate every cultivar, determine a universal roasting endpoint or test consumer preference for a commercial product. Its two nominal temperatures and three durations defined a comparative programme. Its extract preparation and sampling procedures defined the material presented to each instrument. These details allow the observations to be interpreted at their actual scale, while the separate business profile establishes only that tailored roasting was offered in Shenyang. No laboratory result here verifies the flavor or quality of that business’s coffee.
A complete record of these comparisons therefore retains the roasting condition and the analytical route together. The temperature-and-time labels identify how the beans were processed; preparation details identify the liquid or headspace presented for analysis; sensor values and odor observations identify what was measured. The Yellow Bourbon experiment kept these layers available for comparison, with distinct patterns emerging from the three datasets. For a description of a roasted batch, the following information preserves the connection between processing and measurement without turning a sensor label, a cluster or a single odor observation into an overall quality grade.
- Material and processing: cultivar, origin and crop information, roasting equipment, stated temperature and duration, with the unroasted reference identified separately.
- Extract preparation: grinding specification, coffee-to-water quantities, brewing temperature and brewing time.
- Analytical route: liquid dilution and sensor contact, headspace sampling, or fibre collection followed by chromatography and olfactory observations.
- Result and scope: sensor response or analytical profile, repeated-analysis count, sample grouping and the specific conditions represented by that grouping.
Business context: Xinhua, 1 July 2025. Technical discussion adapted in original English from Seong Jun Hong, Chang Guk Boo, Sojeong Yoon, Hyangyeon Jeong, Seong Min Jo, Moon Yeon Youn, Jae Kyeom Kim, Young Jun Kim and Eui-Cheol Shin, published 4 January 2024; DOI: 10.1016/j.fochx.2024.101119, licensed under CC BY 4.0. Structure and wording have been changed; source figures and tables are not reproduced.

Leave a comment