Maple syrup: harvest swings, growing taps and the reserve
Canada’s 2024 maple harvest rebounded across four provinces, supported by a growing tap base and a production chain linking forests, collection systems and sugarhouses.
Published Mar 25, 2024
Quebec's strategic maple syrup reserve held 6.9 million pounds in 2023, its lowest quantity since 2008, against a stated storage capacity of 133 million pounds. The reserve stores syrup in barrels across several warehouses in Canada's largest maple-producing province. The low stock followed poor harvests and rising demand. Tens of thousands of barrels form the stored supply across the reserve's warehouses.
Quebec Maple Syrup Producers deputy director general Simon Doré-Ouellet expected replenishment to take several years. In March 2024, he anticipated no near-term supply problems and described encouraging production during the season then underway. Producers had received 14 million additional taps over the preceding three years, according to his account. Their harvest subsequently became part of a national recovery: maple production increased in all four provinces covered by the annual Canadian production series during 2024.
A recovery across the producing provinces
Canadian maple production reached 19.897 million gallons of syrup equivalent in 2024. The preceding five seasons had included both expansion and contraction: production stood at 14.304 million gallons in 2020, fell to 11.311 million in 2021, rose to 17.406 million in 2022 and dropped to 10.430 million in 2023. Maple butter, taffy and sugar are included after conversion into syrup equivalent. The annual production series covers commercial production separately from inventory held in storage.
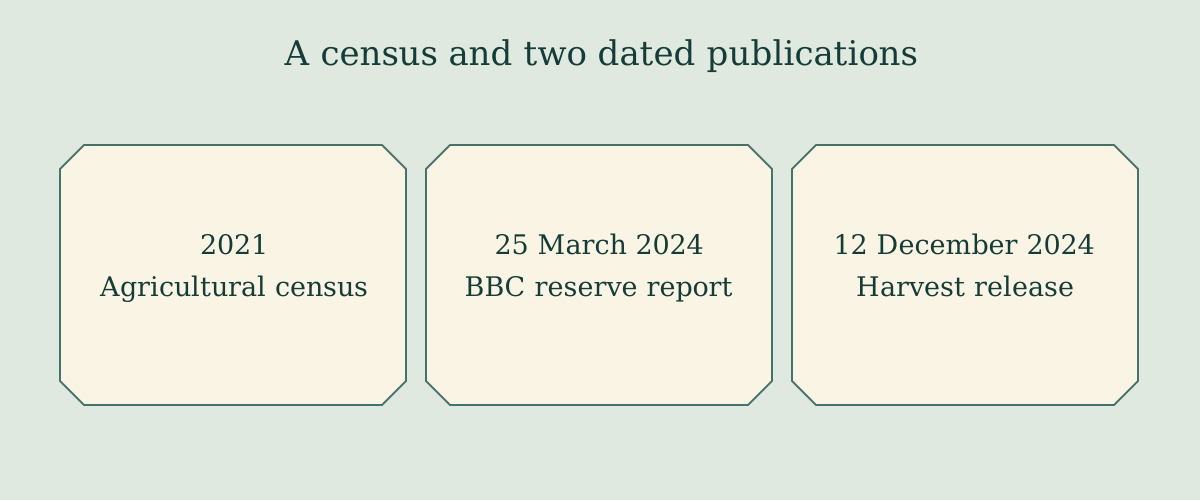
Illustration details
- A census and two dated publications
- 2021
- Agricultural census
- 25 March 2024
- BBC reserve report
- 12 December 2024
- Harvest release
The 2024 crop exceeded the previous year's volume by 9.467 million gallons, an increase of approximately 90.8% calculated from the published quantities. It also surpassed the 2022 crop by 2.491 million gallons, or about 14.3%. The preceding 2022–2023 contraction had removed 6.976 million gallons from annual production, a fall of approximately 40.1%. These season-to-season changes occurred within a producing region dominated by Quebec, with smaller commercial harvests in New Brunswick, Ontario and Nova Scotia.
Quebec produced 18.041 million gallons in 2024, approximately 90.7% of the Canadian total. Its output had reached 13.220 million gallons in 2020 before falling to 10.027 million in 2021. The province then harvested 15.950 million gallons in 2022 and 9.386 million in 2023. The 2024 increase amounted to 8.655 million gallons from that lower level. Higher yields and an expanded number of taps accompanied the recovery, following a year affected by adverse weather.
New Brunswick's 2024 production reached 1.206 million gallons, equivalent to about 6.1% of national output. The province had produced 561,000 gallons in 2020, 786,000 in 2021 and 811,000 in 2022. Production dropped to 527,000 gallons in 2023 before the following season's expansion. The increase between 2023 and 2024 was 679,000 gallons, approximately 128.8%. Expanding production and stronger yields accompanied this rebound after poor weather had reduced the previous year's crop.
Ontario harvested 607,000 gallons in 2024, approximately 3.1% of the national total. The province's production had been 467,000 gallons in 2020 and 462,000 in 2021, followed by 590,000 in 2022 and 502,000 in 2023. The 2024 harvest added 105,000 gallons to the preceding season's output. Early warm temperatures extended the season for some Ontario producers, following a delayed and shorter 2023 season associated with cold temperatures. The provincial annual increase was approximately one-fifth.
Nova Scotia produced 43,000 gallons in 2024, its smallest contribution among the four provinces in the commercial production series. Its earlier published harvests included 56,000 gallons in 2020 and 36,000 in 2021. The 2024 provincial crop was almost one-third larger than the previous year's. Nova Scotia's 2022 and 2023 volume cells carry an unpublished-data quality designation. Its 2024 output represented about 0.2% of the national crop, alongside the much larger contributions from Quebec, New Brunswick and Ontario.
Canadian producers exported 8.4 million gallons of maple products during the first three quarters of 2024, an increase of 8.8% over the corresponding period in 2023. The principal destinations included the United States, Germany, the United Kingdom, Australia, France and Japan. The export figure covers January through September, while the harvest quantities for Quebec, New Brunswick, Ontario and Nova Scotia cover their annual commercial production.
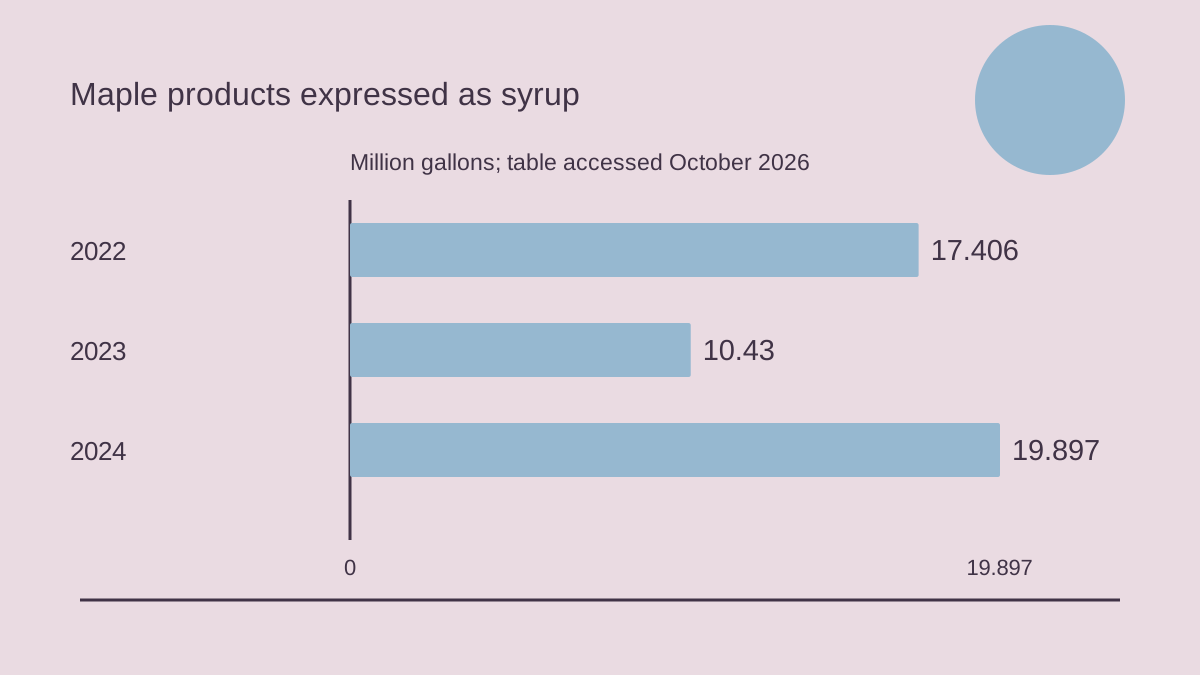
Illustration details
- Maple products expressed as syrup
- Million gallons; table accessed October 2026
- 0
- 19.897
- 2022
- 17.406
- 2023
- 10.43
- 2024
- 19.897
Production value and regional businesses
Canadian maple products had a gross production value of C$881.425 million in 2024 in the annual table used here. The category includes maple syrup, sugar, taffy and butter. Earlier national values were C$562.389 million in 2020 and C$453.034 million in 2021. Commercial production and value figures exclude inventory. The 2024 total consisted of the recorded values for Quebec, New Brunswick, Ontario and Nova Scotia, the same four provinces represented in the annual commercial volume series.
Quebec's maple products were valued at C$794.100 million in 2024, about 90.1% of the national total. In 2020, the province's value had been C$513.150 million; in 2021 it was C$393.186 million. Quebec reached C$636.000 million in 2022 before returning to C$393.400 million in 2023. The 2024 harvest combined a sharp increase in physical output with a provincial production value that exceeded each of those earlier annual amounts. The monetary series covers the combined maple-product category.
New Brunswick's maple production was valued at C$51.973 million in 2024, compared with C$20.756 million in 2023 and C$33.005 million in 2022. Ontario's value reached C$33.097 million in 2024, up from C$28.614 million in 2023 and C$31.672 million in 2022. Nova Scotia contributed C$2.255 million in 2024. Together, those three provinces supplied C$87.325 million of the national value, with Quebec providing the remaining C$794.100 million. All amounts in this provincial comparison are Canadian dollars.
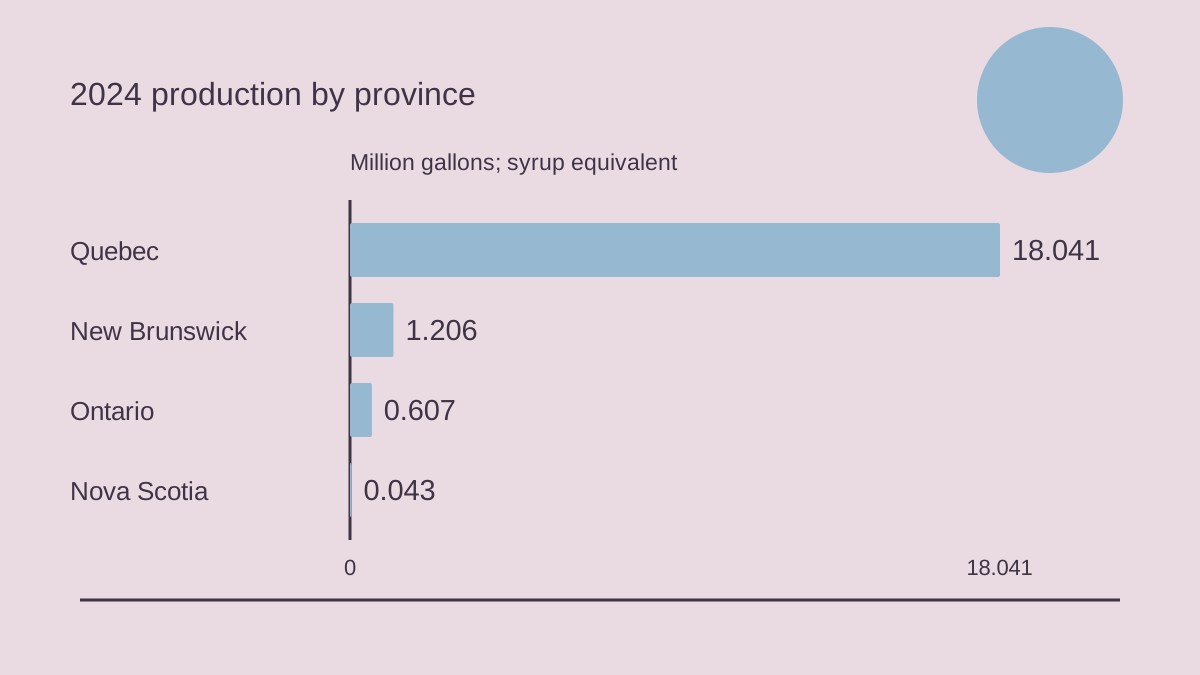
Illustration details
- 2024 production by province
- Million gallons; syrup equivalent
- 0
- 18.041
- Quebec
- 18.041
- New Brunswick
- 1.206
- Ontario
- 0.607
- Nova Scotia
- 0.043
The maple business population had grown before the recent harvest swings. Canadian farms classified under maple syrup and products production numbered 5,248 in 2011, 5,340 in 2016 and 6,364 in 2021. The five-year increase from 2016 was 1,024 farms, approximately 19.2%. Quebec accounted for most of that classified group, while Ontario, New Brunswick and Nova Scotia supplied smaller populations. Other provinces also contained a small number of farms classified in maple production, extending the census geography beyond the four provinces in the annual commercial crop series.
Quebec had 4,674 farms classified in maple syrup and products production in 2011, rising to 4,776 in 2016 and 5,812 in 2021. The province gained 1,036 classified farms between the latter two censuses. Its share of the national classified group was approximately 91.3% in 2021. Ontario's corresponding counts were 416 farms in 2011, 391 in 2016 and 389 in 2021. New Brunswick had 108, 111 and 114 respectively, with gradual growth across those three census dates.
Nova Scotia's maple-classified farm population moved from 36 in 2011 to 48 in 2016 and 39 in 2021. Prince Edward Island had two such farms in both 2011 and 2021. Manitoba's count moved from six to five over that decade, while British Columbia's declined from five to two. Saskatchewan had one maple-classified farm in 2021. Newfoundland and Labrador and Alberta had no farms in that classification at the 2021 census. The maple farm-type category sits within the broader classification of agricultural businesses by their production activity.
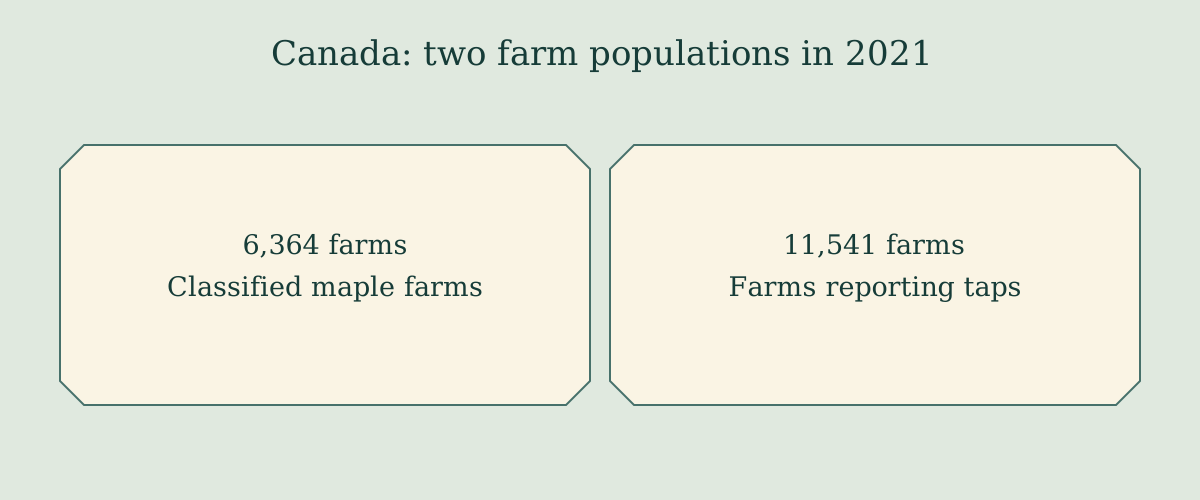
Illustration details
- Canada: two farm populations in 2021
- 6,364 farms
- Classified maple farms
- 11,541 farms
- Farms reporting taps
A growing network of taps
Canadian farms reporting taps formed a broader census population than farms classified as maple businesses. In 2021, 11,541 farms reported a combined 54,647,591 taps. The corresponding totals had been 11,468 farms and 46,995,360 taps in 2016, and 10,847 farms with 44,440,024 taps in 2011. Between 2016 and 2021, reported taps increased by 7,652,231, approximately 16.3%. Across the full 2011–2021 period, the national tap count grew by more than 10.2 million.
Quebec's 8,653 farms reporting taps accounted for 48,672,648 taps in 2021, approximately 89.1% of the Canadian total. The province had reported 40,632,512 taps across 7,639 farms in 2011 and 42,529,033 taps across 7,863 farms in 2016. Its five-year increase after 2016 exceeded 6.1 million taps. The 2021 average was 5,625 taps per reporting farm, compared with 5,409 in 2016. These provincial totals place Quebec at the centre of Canada's reported tapping activity as well as its commercial harvest.
New Brunswick had 3,523,948 taps across 188 reporting farms in 2021, compared with 2,285,785 taps across 212 farms in 2016. The province's average increased from 10,782 to 18,744 taps per reporting farm. Ontario had 2,013,549 taps across 2,469 farms in 2021, following 1,713,022 taps across 3,003 farms in 2016. Its average rose from 570 to 816 taps. Both provinces expanded their reported tap totals during a period in which their numbers of farms reporting taps declined.

Nova Scotia reported 420,383 taps across 120 farms in 2021, with an average of 3,503 taps per reporting farm. Its 2016 population had comprised 446,300 taps across 187 farms, averaging 2,387. Prince Edward Island reported 10,299 taps across ten farms in 2021. Smaller reported totals included Manitoba's 4,581 taps across 53 farms, Saskatchewan's 332 across 17, and British Columbia's 1,851 across 31. The census tap series notes that some respondents may include taps on other tree species, such as birch.
The national average increased from 4,098 taps per reporting farm in 2016 to 4,735 in 2021. Regional averages ranged widely: New Brunswick's 18,744 exceeded those of Quebec, Nova Scotia and Ontario. The national classified population of 6,364 maple farms and the broader group of 11,541 farms reporting taps coexist in the agricultural census. Farm types are classified by agricultural activity, while the tap series records farms reporting the specified resource. Changes in farm classification over time can reflect changes in activity, commodity prices, or both.
From a tapped tree to concentrated syrup
Maple sap is collected from dormant trees through drilled holes that expose conductive xylem tissue. A tree's response to tapping includes compartmentalization around the injury and the accumulation of nonconductive wood; annual growth adds new conductive wood. The common tap-hole diameter became smaller over the roughly three decades discussed by maple specialist Mark Isselhardt in his 2023 production overview, moving from seven-sixteenths of an inch to five-sixteenths.
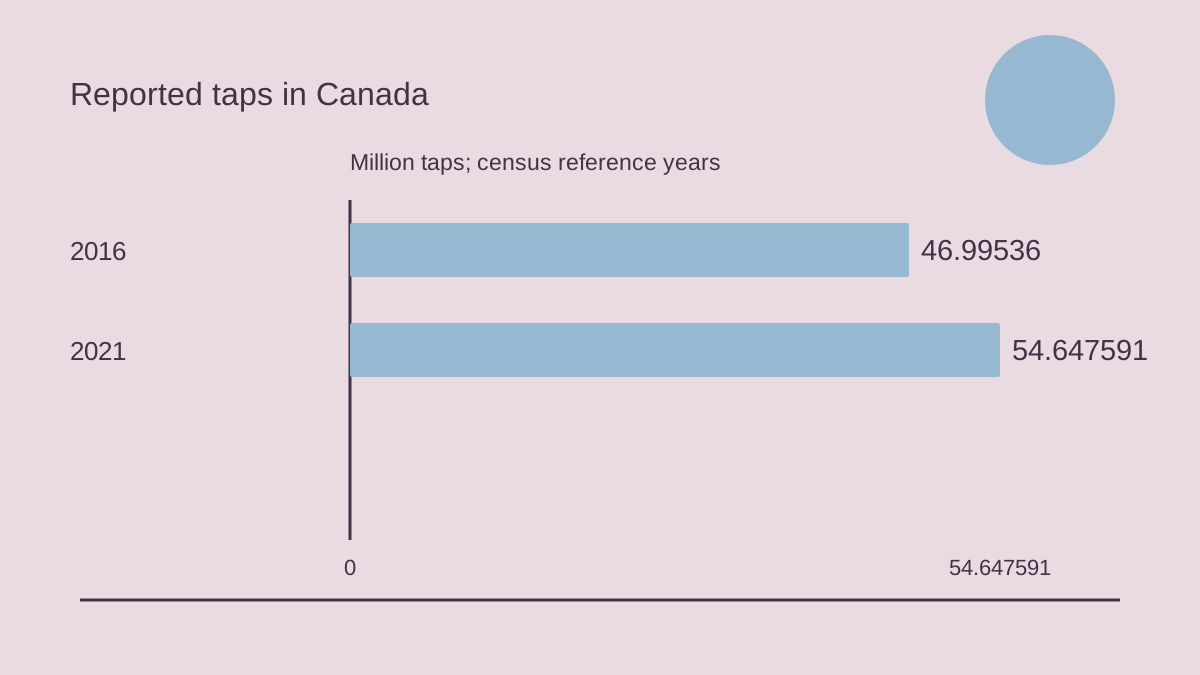
Illustration details
- Reported taps in Canada
- Million taps; census reference years
- 0
- 54.647591
- 2016
- 46.99536
- 2021
- 54.647591
Modern maple operations use plastic tubing, vacuum pumps and membranes in collection and processing, supporting higher sap yields and reductions in energy and labour requirements. In a 2021 survey of 312 northeastern US maple producers, operations with more than 5,000 taps supplied approximately 81% of reported syrup production. Those larger operations represented 18% of survey respondents.
Maple products reach the market in several physical forms. Liquid syrup accompanies maple sugar, taffy and maple butter within Canada's production category. For the national volume series, sugar, taffy and butter are converted into syrup equivalent. Its conversion notes give ten pounds of maple sugar as equivalent to one gallon of syrup and list a syrup-gallon weight of 13.24760 pounds. The taffy conversion varies with syrup density in the relevant year. Quebec and Nova Scotia are the provinces specifically identified as reporting maple taffy.
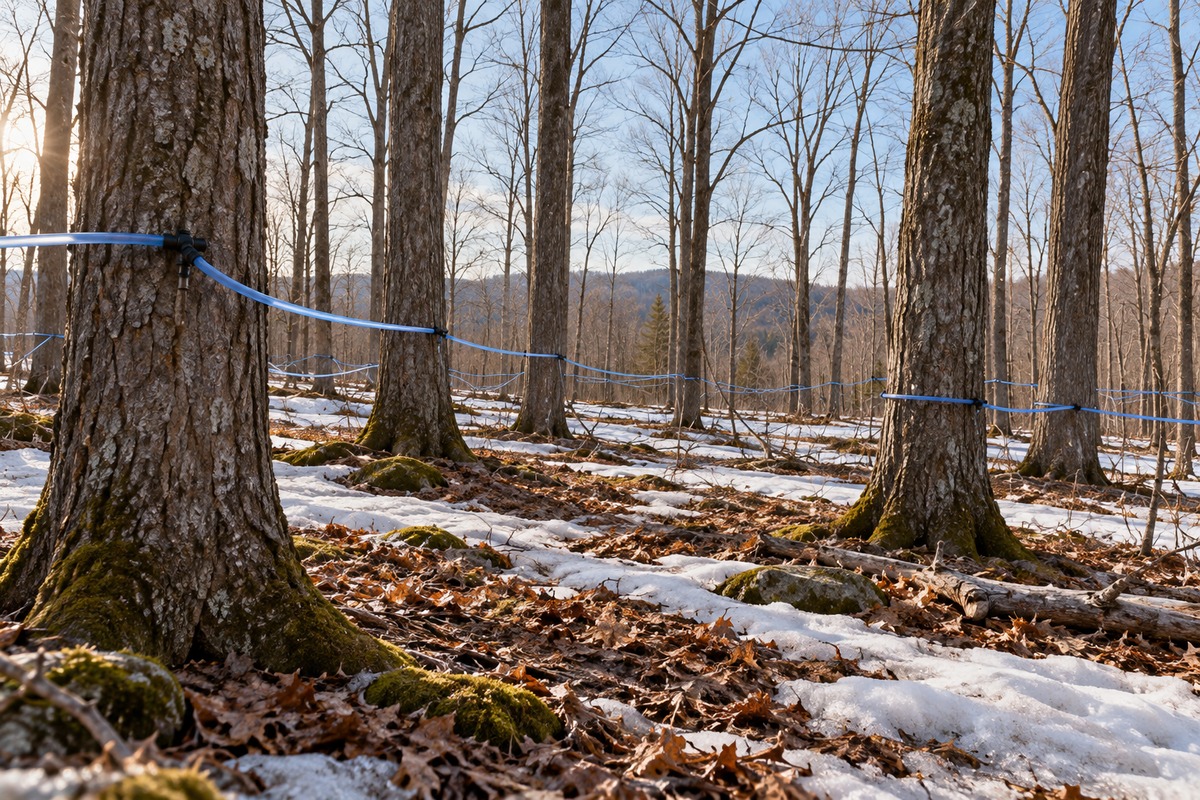
- Sap collection takes place in the forest, using taps and collection equipment.
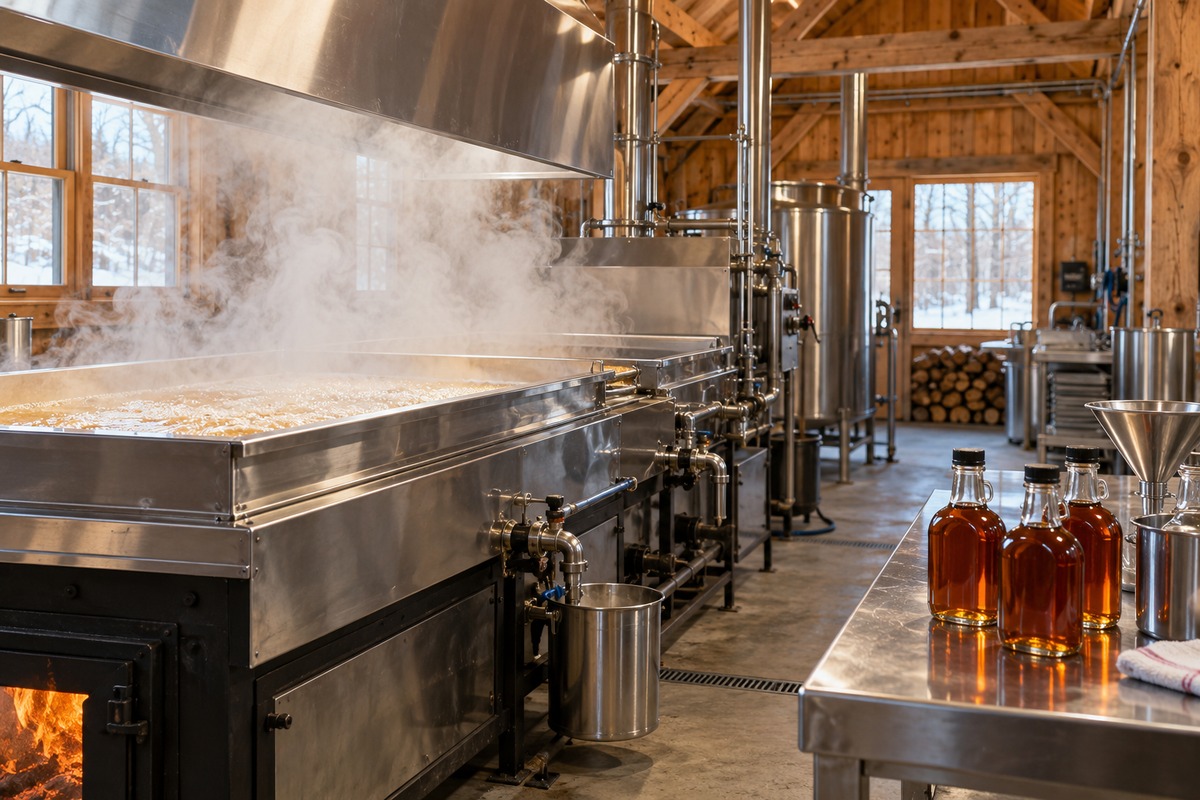
- Evaporation removes water during syrup processing.
- Maple syrup, sugar, taffy and butter are included in the Canadian maple-product category.
In Wilton, Maine, Russell Black operated a 40-acre maple farm with nearly 1,200 tapped trees. He sought help from the USDA Natural Resources Conservation Service when upgrading the equipment used to cook sap into syrup. A wood-fired evaporator removed water from the sap during boiling. The service's Environmental Quality Incentives Program assisted with a reverse-osmosis system and an evaporator preheater. These additions joined the existing forest collection work and wood-fired boiling stage at one named maple operation.
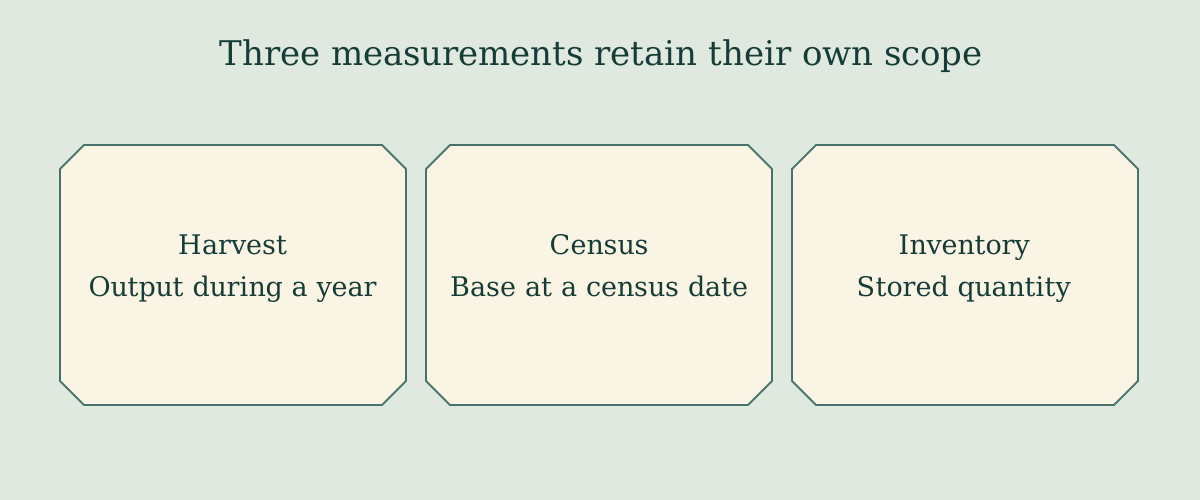
Illustration details
- Three measurements retain their own scope
- Harvest
- Output during a year
- Census
- Base at a census date
- Inventory
- Stored quantity
Black's boiling time fell by at least half after the improvements, according to the agency's December 2024 account. Reduced boiling cut the amount of wood burned during processing, with accompanying reductions in energy use and costs attributed to the upgrade. Black's case was featured in the Conservation at Work video series, which presented farmers, ranchers and forest landowners using conservation practices in their operations.
The assistance reached Black through an agricultural conservation service operating beyond maple production. By December 2024, NRCS offered more than 160 conservation practices, and the Conservation at Work series featured more than 80. Local conservationists planned practices around individual operations, including farms, ranches and forest holdings. Participation in NRCS programs was voluntary, with assistance available through local offices.
Earlier Canadian commercial harvests included 8.551 million gallons in 2011 and 12.160 million in 2016. Their national gross values were C$339.154 million and C$484.109 million respectively. In 2016, Quebec produced 11.185 million gallons, New Brunswick 528,000, Ontario 398,000 and Nova Scotia 48,000. The provincial production values for that year were C$435.600 million in Quebec, C$22.023 million in New Brunswick, C$23.286 million in Ontario and C$3.200 million in Nova Scotia.
Adapted from Statistics Canada, Production and value of maple products (Table 32-10-0354-01), 2011–2024; Maple taps, Census of Agriculture historical data (Table 32-10-0161-01), 2011, 2016 and 2021; Farms classified by farm type, Census of Agriculture historical data (Table 32-10-0166-01), 2011, 2016 and 2021; and Maple products, 2024, released 12 December 2024. This does not constitute an endorsement by Statistics Canada of this product. Comparisons are calculated from the cached table values. Production-technology background: Mark Isselhardt, 2023, GTR-NRS-P-211, pp. 164–167. Maine case: Joanna Pope, USDA NRCS, 17 December 2024.
Leave a comment